
SoundEasy tutorial – Loudspeaker frequency response measurement
How to make a full range frequency response measurement using SoundEasy?
This SoundEasy tutorial will be like the wrapping for the previous articles. We have done the far-field and the near-field measurements, which will be at the core of this tutorial. For this reason, make sure you read them first. If you haven’t, you will think I’m skipping steps in the explanation. In conclusion, we will make a near-field measurement for the low frequencies, and a gated far-field measurement for the mid-high frequencies. Splice the two responses at the right point, and voila, full range anechoic frequency response.
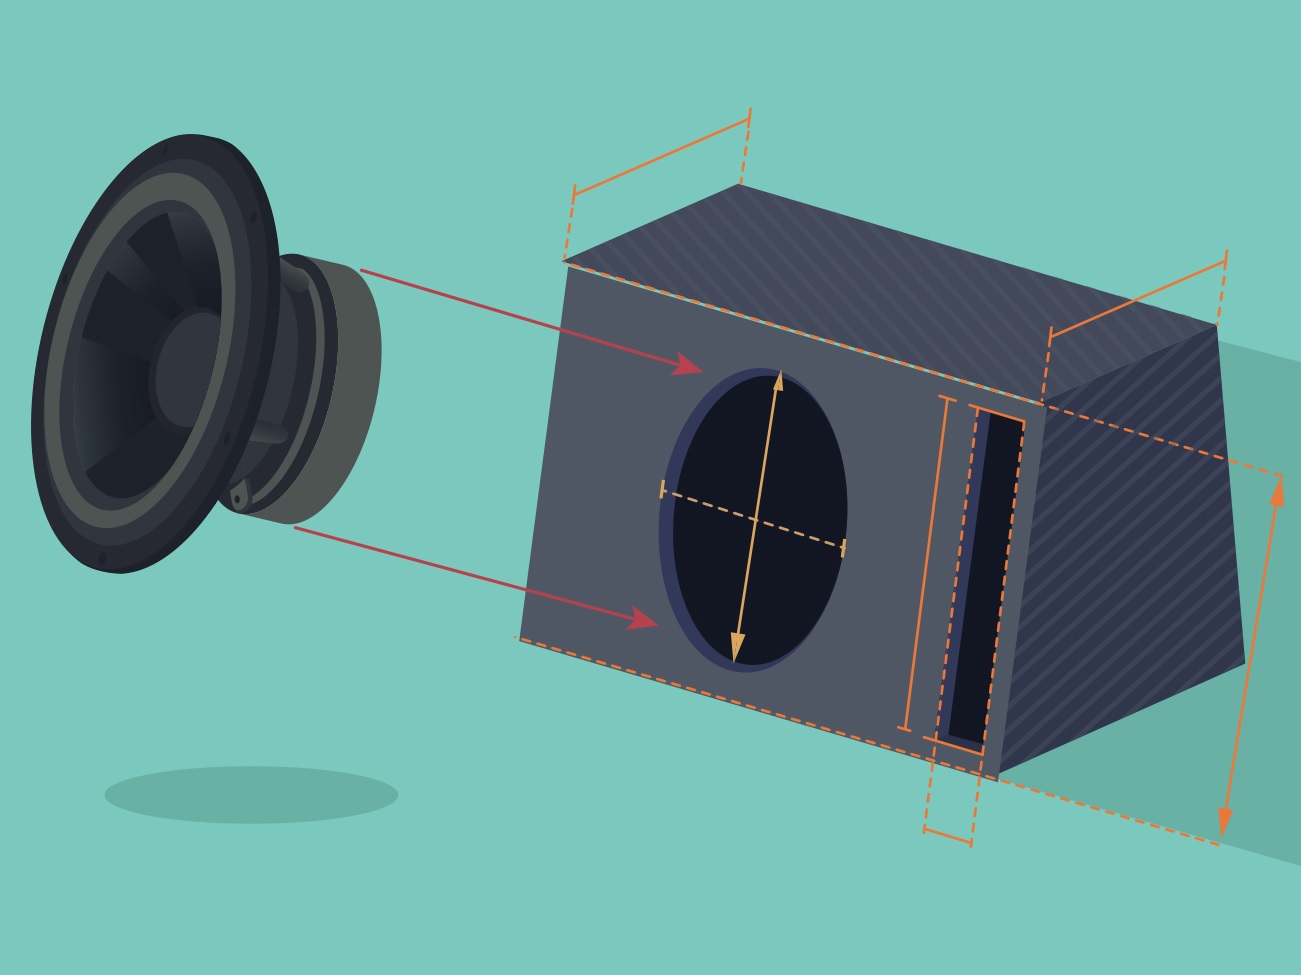
Device under test
For our little SoundEasy tutorial, I am going to use a bass-reflex bookshelf speaker, which uses a midbass driver, a tweeter and rear-firing port.
- Mid-bass driver : Seas CA 18 RNX. (Amazon affiliate paid link)
- Tweeter : Vifa XT25TG30-04. (Amazon affiliate paid link)
The enclosure is about 15 liters in volume, and it’s tuned at around 51 Hz. It uses a non-refined 2nd order Linkwitz-Riley crossover, just for the sake of this tutorial. Therefore, don’t judge the frequency response at the end. The crossover is not polished and it’s only to protect the tweeter and split frequencies.
Step 1 : Set the levels correctly
This is very important. You have to realize that we are combining several response curves into one. In conclusion, you have to use the same signal/volume settings for all of the measurements. Furthermore, we will have to do additional scaling (like scaling near-field to far-field), so we can combine the response curves.
Before you start to fiddle with the levels, place your microphone for a near-field measurement. This is the worst case scenario in terms of loudness. Imagine you start with far-field and set your levels accordingly. Then, you move to near-field and find that the levels are too high. Now you can’t lower the volume, because you have too keep the same level throughout the whole process. As a result, start with near-field. If you have a small diameter port, chances are it will be louder than the speaker. In conclusion, start with the port, otherwise, start with the speaker.
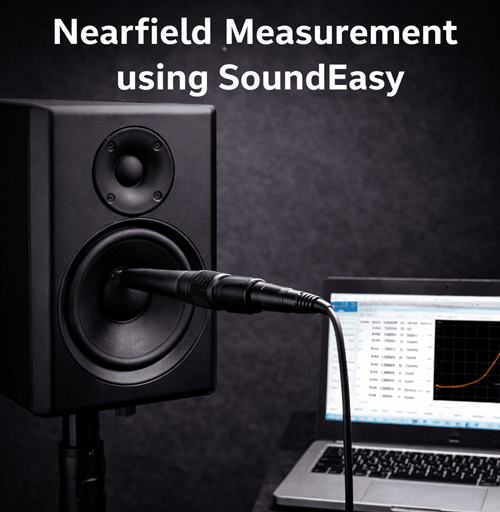
Step 2 : Near-field measurement
I trust you already set up your baffle dimensions, driver placement and size. This will be needed when adjusting for diffraction. I have a large diameter port compared to my speaker, and I even checked by measuring, and the speaker is louder than the port (in a near-field measurement). Therefore, I am starting with the speaker. Set the levels as high as you can without clipping. This will ensure an adequate level when moving to far-field.
Get the levels to something like this. As high as you can go, without clipping. Then, go ahead an do the near-field measurement for the port and for the speaker.

This is the same speaker and enclosure we used in the near-field measurement article. This means we got the same 68 mm port, and we need to scale the port response by -8 dB. Add the 2 curves and apply baffle step compensation.

This concludes the near-field part of this SoundEasy tutorial.
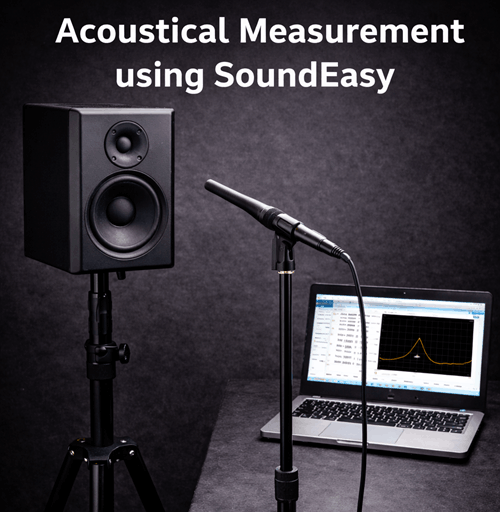
Step 3 : Far-field response
I’m measuring in the exact same room as in the far-field article. This means my window is 4.7 ms

As you can see, the levels are really low, but it doesn’t matter, we have to keep the same settings on all measurements.

Here you can see both responses, and there is a massive difference when comparing amplitudes.
Step 4 : Scale near-field to far-field
Basic acoustics tells us that doubling the distance means losing 6 dB of output. I estimate that the microphone was placed 2 mm away from the speaker (really close). As the speaker gets larger you can placed it a bit further away, but let’s stick to our example. Now you have to double the distance : 2 mm – 4 mm – 8 mm – 16 mm etc, and add 6 dB for each interval. Either that, or use this formula :
20 * log (near-field distance / far-field distance)
This means we need to scale our response by 20 * log (0.2 / 100) = -53.98 dB. In conclusion, we need to add -53.98 dB to the near-field response, to be at the same level of the far-field response.

This was a lucky guess, since it’s very hard to estimate the distance between the microphone and the speaker. A more realistic and reliable way is to make sure the graphs overlap in the section where they both have valid responses. This would be somewhere in the 300 to 600 Hz area. As you can see above the graphs intersect at 350 Hz, which is great.
Step 5 : Splice the 2 responses
To continue this SoundEasy tutorial, we need to reflect on what we have learned from the previous 2 articles :
- Our near-field response is valid 20 Hz – 800 Hz.
- Our gated far-field response is valid 250 Hz – 20 000 Hz.
How to design loudspeakers - video courses


This means we need to merge the 2 graphs somewhere in the 250 – 800 Hz. While this seems a nice range from where to pick your spot, my advice is the following :
- Try to merge as close as possible to the lower limit (250 Hz).
- Try to merge in a point where the 2 curves intersect (if they do).
For this reason I choose to splice the 2 response at the 350 Hz mark.

Write in the corresponding boxes which graphs you want to merge and the chosen frequency. The first one should be the near-field and the 2nd one the far-field. So, I’m merging 3 with 2 at 350 Hz. This will copy the resulting curve into the Master Buffer. Therefore, make sure you copy the Master Buffer into a free slot (4 in my case).
Conclusion of this SoundEasy tutorial
We have done these kind of measurements in the past, using other software. Now we can truly say we have made a full range quasi-anechoic frequency response measurement using SoundEasy. Since the curve shows a relative amplitude (not absolute), we can add several dB, so it’s on top of red line. That way it’s easier to interpret its linearity.

References
- Image source : AI generated

Learn loudspeaker design from scratch
