
Loudspeaker impedance measurement using a multimeter
How to measure speaker impedance?
Making a loudspeaker impedance measurement is not a as easy as you might think. If you compare to resistance, impedance changes value with frequency. Therefore, an impedance measurement is actually a graph, not a number. Normally, there is specialized hardware that does this stuff in a second, automatically plotting the graph. Anyway, let’s be resourceful and make a loudspeaker impedance measurement with what we have.
Equipment needed
The title states that only a multi-meter and 2 resistors are needed, but the measurement requires additional items, which most likely you already have. The resistors can be found at your local electronics store for basically no money.
The list :
- A multi-meter.
- A computer running Room EQ Wizard software (which is free).
- A speaker amplifier.
- 1000 Ohm / 5 watt resistor. (Amazon affiliate paid link)
- 10 Ohm / 5 watt resistor. (Amazon affiliate paid link)
- This Excel spreadsheet.
Here is how the excel spreadsheet looks like. By the end of the article, it will be all filled out, and the impedance graph will show on the right.

Room EQ Wizard will be used as a signal generator software, in conjunction with the amplifier. Normally, you would have a stand-alone signal generator, but a good one is pretty expensive and doesn’t have other uses. I’m guessing you already have a computer. Since you are making a loudspeaker impedance measurement, I’m guessing you already have an amplifier too. The software is free.
Loudspeaker impedance measurement method
The technique we are using in this tutorial is the voltage divider method, with some additional tweaks. Normally you would have a standalone signal generator which can maintain a constant voltage. In that case we would measure the resistor just once. However, in our tweaked scenario, we will have to measure the resistor just as many times as we measure the speaker. This will make more sense later on.
Advantages :
- Equipment readily available or cheap/easy to come by.
- It doesn’t take as much time and less tedious than other methods (current source method).
- Speaker is connected to an amplifier. This will emulate a real-life scenario, since the amplifier’s damping will be taken into account.
Disadvantages :
- High impedance drivers may affect the measurement accuracy.
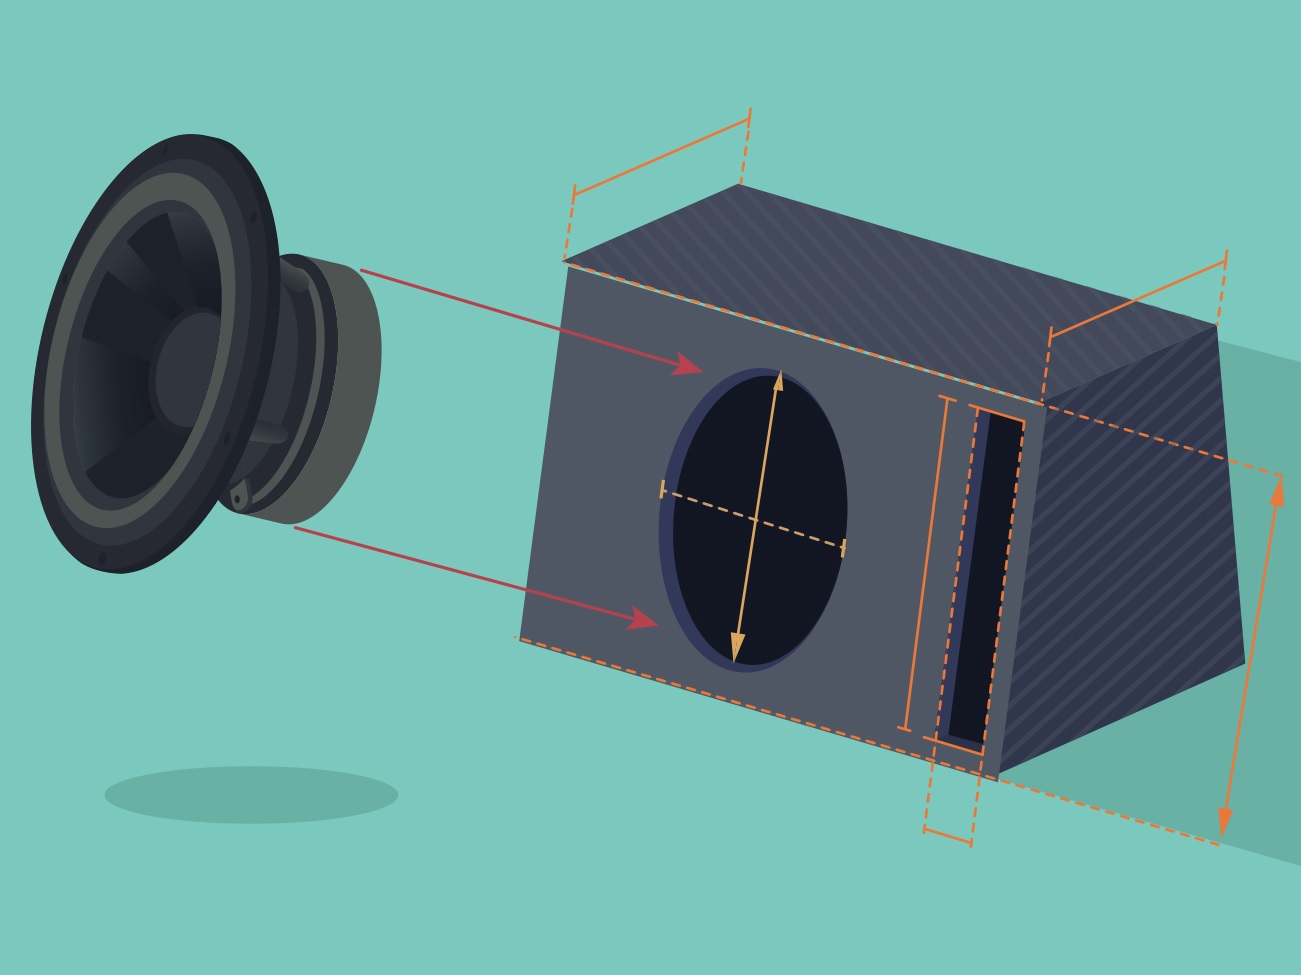
Now, to give a general picture on how the loudspeaker impedance measurement works, here is a diagram :

The basic principle is that you set a level for your amplifier. With the speaker in place, set the generator to a certain frequency you are interested in. Take a reading on the volt-meter. Swap the speaker with the resistor and take another voltage reading. Since the resistance of the resistor in known, you can calculate the resistance of the speaker at that particular frequency. Write it down, and repeat this step for different frequencies, until you have sufficient data to plot the graph in the excel spreadsheet.
Bear in mind that you will not make this swap every step of the way. First measure the speaker for all the frequencies you are interested in, and then switch to the resistor. Shouldn’t take that much time.
Step 1 : Room EQ Wizard (REW) setup
First of all, download the software here. Normally you would have to make a lot of adjustments for the microphone and stuff, if you plan to use this software for what it was intended to, but we are going to use only the signal generator.
How to design loudspeakers - video courses


Go to Preferences -> Preferences, and make sure that your output device is set correctly (your sound card, most likely). Then, go ahead and click the signal generator icon. Once there, make sure that the output is set to both channels, and that the RMS level is set to its highest point (-3.0). As for the signal type, select sine wave.
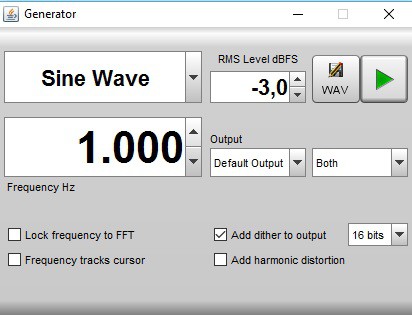
The multi-meter I’m using is the Fluke 177 (Amazon affiliate paid link) which has a frequency counter. As a result, I can check if REW is working correctly.

As you can see, REW works great as a frequency generator, and the numbers are spot-on.
Step 2 : Set your amplifier level
The amplifier needs to have a fixed volume level for the whole process. First of all, hook up your speaker in the rig and set the multi-meter to AC volts. Next, set the signal generator to pink noise and press the play icon. Now fiddle with the amplifier volume knob until you reach a reading of around 150 mV on the multi-meter.

When playing pink noise, the voltage will not be stable. In conclusion, if you have an average function on your multi-meter, use it. Try to reach close to the 150 mV mark.
Step 3 : Establish the points of interest
To complete the excel graph, we have to make some measurements at certain frequency points. We decide these values, but there are certain frequencies which must be on the graph. First of all, you have to decide the resolution of the graph. If you look closely, you will see that the file contains 3 spreadsheets : Impedance x35, x50 and x75. This indicates how many measurement points the plot will contain. As a result, a plot containing more measurement points will be more resolute/accurate, but it will take more time. Regarding this loudspeaker impedance measurement tutorial, the Impedance x35 is the pick, since it is less time consuming.
For a driver in free-air or inside a closed box
For this type of setup, there will be a couple of points of interest that must appear on the graph. This is how the graph should look like :

You must find those 2 frequencies :
- The frequency where the impedance spikes. This corresponds to the resonant frequency of the driver / closed box.
- After the resonant frequency, the impedance starts to decrease, reaches a minimum, and then rises again due to voice coil inductance. That minimum point is important.
For a driver in a bass-reflex box
There are 4 points of interest when we are talking about bass-reflex. Here is how the graph should look like :

Find these 4 frequencies:
- Bass reflex has 2 impedance spikes. Sweep the frequency generator until you find the highest value of the first spike.
- Then the impedance will decrease, and start to rise again. Find the minimum point. This corresponds to the resonant frequency (tuning) of the box.
- Then, the impedance will rise again until it reaches a maximum. Note the frequency of when that happens.
- Finally, just like with the sealed box, the impedance will drop off, reach a minimum, and then rise again due to voice coil inductance. Note the frequency when the minimum occurs.
Other points of interest
When making a loudspeaker impedance measurement, to have a complete graph, you must have these frequencies in your chart :
- The 2/4 frequency points mentioned above for sealed / bass reflex.
- 2 additional points (or more) close to the previous mentioned values. For example : If the resonant frequency is at 57 Hz, make sure you plot 50 Hz and 65 Hz as well.
- The starting points of the graph : 10 Hz and 20.000 Hz.
- Every decade : 100 Hz, 1.000 Hz, 10.000 Hz.
- Every half of decade : 50 Hz, 500 Hz, 5.000 Hz.
- All octaves : 20 Hz, 40 Hz, 80 Hz, 160 Hz, 320 Hz. 640 Hz. 1.250 Hz, 2.500 Hz (5 kHz and 10 kHz already been mentioned).
- Half of octaves : 30 Hz, 60 Hz, 120 Hz, 250 Hz, 2.000 Hz, 4.000 Hz, 7.500 Hz, 15.000 Hz.
- Add frequency points to complete the table and fill obvious gaps : 12.500 Hz, 17.500 Hz etc.
Step 4 : Measure the resistor
Unless you have an expensive resistor, most likely it’s not exactly 10 Ohm. Therefore, we have to measure it.

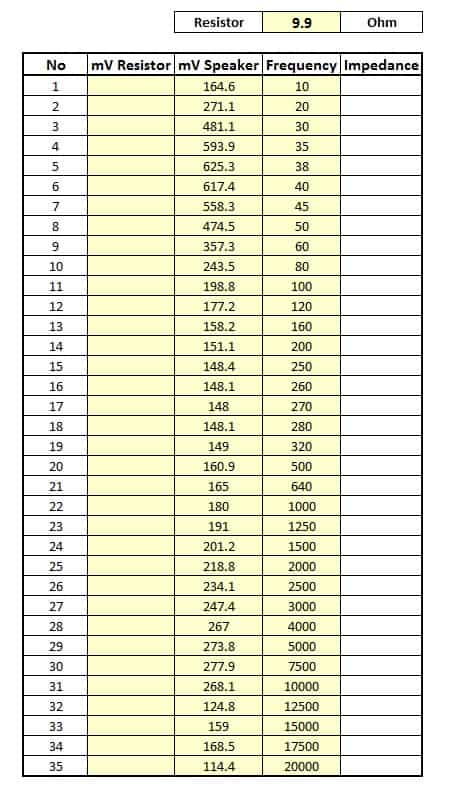
Measure the resistance of the test leads by shorting them. After that, measure the resistor and subtract the value of the test leads. In our case 10 – 0.1 = 9.9 Ohms. Insert that value into the spreadsheet.
Step 5 : Complete the frequency column in the spreadsheet
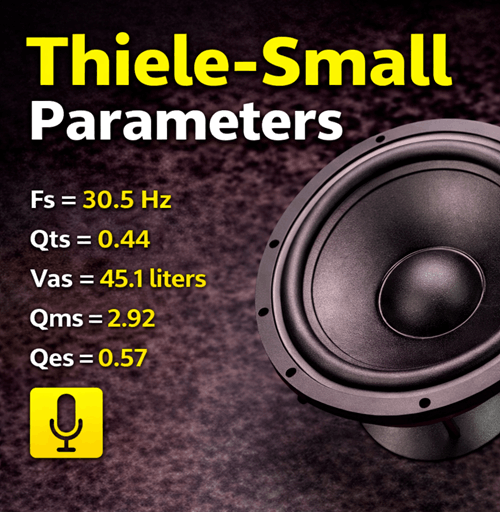
We are going to measure the impedance of a driver in free air : (Seas CA 18 RNX) (Amazon affiliate paid link). The driver has a pole piece in its construction. As a result, I placed the driver on 2 books so the vent is not obstructed. As mentioned earlier, we have to find the highest impedance point (at resonance) and the minimum point, before the impedance start to rise.
How to design loudspeakers - video courses
Place the speaker in the rig, and set the multi-meter to AC volts. Now sweep the frequency, until you see the highest value. Be smart about this. Since it is a mid-bass driver, the resonance will be somewhere between 40 – 80 Hz. If it’s a tweeter aim for 500 – 2000 Hz. After you found it, note down the frequency and the voltage. Then, increase the frequency. You will see the voltage dropping as frequency increases, but at a certain point it will start to rise. Note this minimum point (frequency and voltage), just before it starts to rise.

After we found these important points in the graph, we can begin populating the frequency column, and then we can move on with the loudspeaker impedance measurement. Complete the frequency column similar to this fashion. It is important that the frequency column is in ascending order, otherwise the graph won’t show correctly.
Step 6 : Complete the voltage column (measuring the speaker)
Proceed to place the speaker in the rig. Input each frequency (from the previous step) in the generator, and take a voltage measurement. Each measurement you write down in the corresponding cell. After you’re done, it should look something like this :
When changing the frequency to take another measurement, please do this extra step. Don’t just change the frequency, but also stop and restart the generator. Sometimes I saw obvious erroneous readings. Restarting the generator (depressing and pressing the “play” button) would fix this inconvenience. In conclusion, restart the generator every time you change the frequency.
Step 6 : Complete the voltage column (measuring the resistor)
Go ahead and swap the speaker with the resistor. Do the same thing as you did previously with the speaker. Note down in the correct column all the voltages shown on the multi-meter for each of the corresponding frequencies. After you completed the column, it should look something like this :

As you can see, the impedance column is completed automatically. Please write only in the yellow cells, otherwise you could overwrite the formulas in the impedance column.
Loudspeaker impedance measurement complete
If you have done all the steps, you should see a finished graph on the right.

I know that this looks like a lot of work, but it will take 20-30 minutes. There are other methods out there that are far more tedious. Of course this all makes sense in the absence of specialized measuring equipment. Now you can measure impedance with items that you probably already have.
References
- Loudspeaker Design Cookbook 7th Edition by Vance Dickason (Audio Amateur Pubns, 2005).
- Image source : AI generated
You May also Like


Learn loudspeaker design from scratch

18 comments
Hello,
I have a question for you. I have noticed that the fluke 177 multimeter has, in AC voltage mode, a frequency range of 45Hz-500Hz. Hence I wondered: how have you executed the measurements off this frequency band?
Thank you
The multi-meter is not limited to that frequency bandwidth only. Between 45 – 500 Hz, it has the highest accuracy. Outside this interval, slight errors may occur. However, the purpose of the article was to show how the process is done at a basic level. If you need high accuracy measurements, there are a lot of alternatives out there.
Hello, thanks for the tutoriel. I’ll start measurements in a couple of days.
I’m wondering what are you using when you Do the first sweep to find max peaks and dips?
REW, sweeps doesn’t show you the frequency meter?
I use DATS from Dayton Audio. It’s a standalone device that measures impedance and calculates T/S parameters. You can do that with REW as well but you have to build some resistive probes. Much more accurate and easier to do, but you have to buy the device.
Hi, really thanks for the tutorial. I have some questions about setting amplifier level.
1. If the voltage of pink noise is not stable, why use it?
2. If the output watt will affect the impedance curve?
3. Why you use 150 mV?
1) Because pink noise is a signal that contains all frequencies. If you choose a sine wave you might set your amplifier right for that particular frequency but it might be too high or too low for other frequencies. Using pink noise gives a middle ground.
2) Don’t understand the question.
3) It’s not a fixed number. You can choose something else, but it’s important that any of your measurements (at different frequencies) don’t exceed 1 V. This is a small signal measurement. You don’t want to go too low either, because the measurement will be inaccurate.
Sorry for the silly question, I’m kind of a newbie. Will this work with a complete speaker aswell? Like a full range tower?
Yes, it will work but it will plot the impedance of the whole system.
How did you get the equation for impedance in the excel spreadsheet?
Well it’s not really a formula for impedance, it’s just basic math. For a specific frequency you measure the voltage on a resistor, which has a known resistance. Then you measure the voltage on the speaker for the exact same frequency. By doing a simple cross multiplication, you can calculate the resistance of the speaker for that frequency.
Hi
How to you convert the excel file to a zma file, kindly share.
Many thanks
Just paste the values in txt file and rename the extension to zma. Make sure you have the frequencies on one column and the the impedance values on another column.
.. And make sure you place a point as a decimal point, not a comma 🙂
Don ask how I know this.
Thanks sir for the tutorial.
I have been working with speakers and trying to get impedance at different frequency with what I have – DMM, DIY mini-amp and computer. I had been struggling to get correct impedance values but in vain to the point I kinda gave up. Your answer to Mara question has shown another side of coin and I feel confident on how to get impedance at any point.
Thanks for the tutorial.
I just went through my spares box, and I don’t seem to have the exact value resistors. But I think that actually shouldn’t matter. If I were to use 1.5k and 22 Ohm I don’t think that would change the outcome?
Yep, you can use those.
Hi Marius, do you have a file to download, of those values in the Table?
Thanks Mac
Hi Marius,
With a signal generator and correcting for some voltage drop or increase at some frequencies and reading the voltage at a scope, do I need to do the process of reading the know resistance (10 Ohm) for each frequency or just accet the readings directly from scope?