
Speaker impedance curve explained with examples
What is impedance?
Before we get the speaker impedance curve explained, let’s get down to the basics. When you apply a voltage, an electrical system will exhibit a certain amount of opposition to current. We call this opposition impedance, and it is measured in ohms. Let’s make a distinction between impedance and resistance, which both share the same unit of measurement (ohms), but are not the same thing.
- Resistance is used when the circuit is driven by DC current. It will have a fixed value.
- Impedance is used when the circuit is driven by AC current. Because the current is alternating, the impedance will have not only magnitude, but phase also.
A speaker system uses AC current, so impedance is our culprit. Impedance changes value with frequency. When you take a look at a speaker’s spreadsheet, you might see both values of resistance and impedance. You might see something like Re=3.4 ohms (resistance) and Z=4 ohms (impedance). Re is the DC resistance of the voice coil and Z is the nominal impedance. The term nominal signifies the mean value, because the impedance changes with frequency. This means that the impedance will mostly be around 4 ohms, but it can reach values as high as 50 ohms are go as low as 2.5 ohms.
Speaker impedance curve explained
Speaker impedance is not a single value, instead, it changes with frequency. This means that you will need a graph to accurately tell the impedance of a driver. Also, since the enclosure will affect the properties of the speaker, the impedance graph will change also. Let’s get the speaker impedance curve explained for a driver in free air and for a driver in a sealed enclosure.
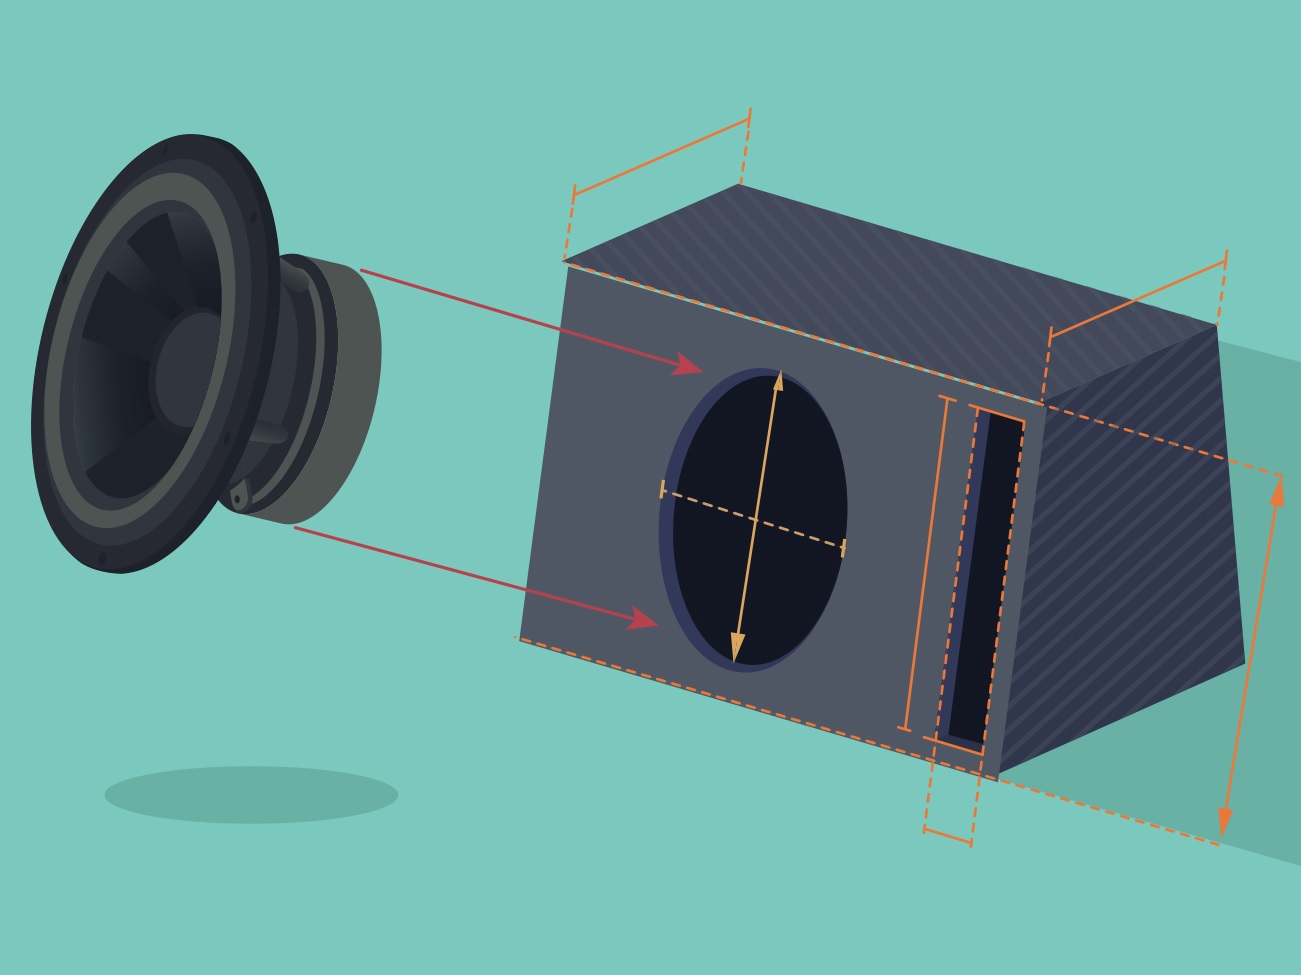
Driver in free air and sealed enclosure
Let’s analyze the impedance chart of a driver in a sealed enclosure. If the driver is in free air or in a closed box, the impedance chart will look similar. The spike in impedance will be at a higher frequency, because the enclosure will raise the resonant frequency of the system.

- The bold line is the impedance. We measure the magnitude of the impedance in ohms, and you can read the value on the left side of the graph.
- The dotted line is the phase. We measure phase angle in degrees, and you can read the value on the right side of the graph.
Impedance
There are several ques in the graph that reveal useful information, so let’s get the speaker impedance curve explained :
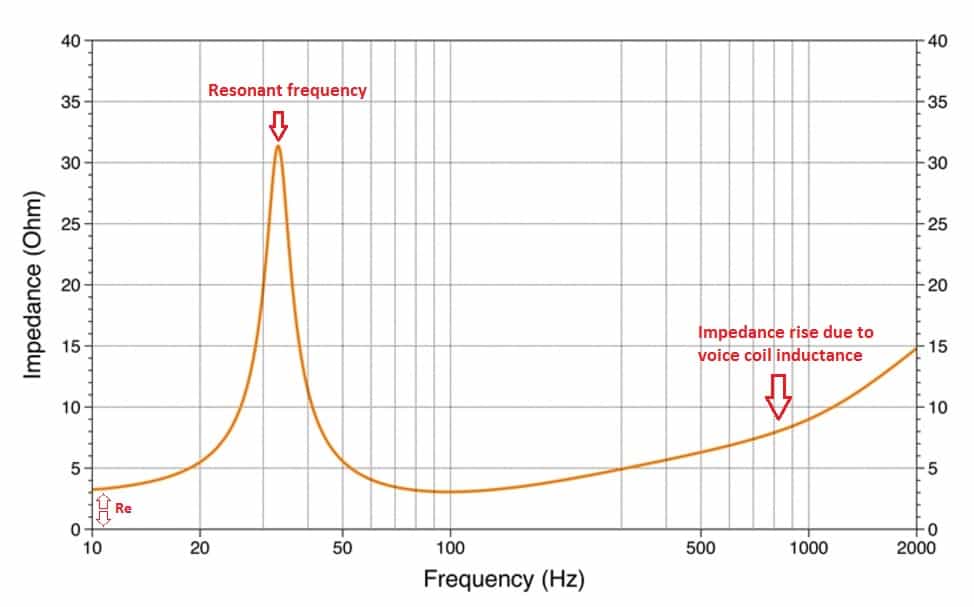
- The lowest value on the left of the chart is the DC resistance (Re). Which in our graph looks like 3.2 ohms.
- The manufacturer quotes the nominal impedance, but that is the mean value of the impedance. Just a few ticks higher than Re. In our case, the nominal impedance is 4 ohms.
- The peak in the impedance chart represents the resonant frequency. Either for a driver in free-air or for a driver in a sealed enclosure, the peak will tell the resonant frequency of the system. For the closed enclosure the resonant frequency will be slightly higher, if we compare it to the same driver in free air.
- As the frequency goes up, so does the impedance. The speaker has a voice coil in its construction, which is an inductor. This will exhibit an inductive reactance, which opposes the current flow. Since this inductive reactance is directly proportional to frequency, this explains the impedance rise with frequency.
Phase angle
In a reactive circuit (which has inductive and capacitive properties), there will sometimes be a phase mismatch between current and voltage. This means that the current will lead or lag the voltage by a certain time period. This difference is called phase angle and it’s measured in degrees.

Phase angle characteristics :
- In a capacitive circuit, the current will lead the voltage, resulting in a negative phase angle.
- The current will lag behind the voltage, in an inductive circuit, resulting in a positive phase angle.
- In a purely resistive circuit, the current and voltage are in phase, resulting in a 0 phase angle.
Now let’s get back to the audio world and let’s get the speaker impedance curve explained :

Depending on how reactive the speaker system is, the phase angle will take different values. The phase angle will have 0 degrees at the resonant frequency and at the point where the impedance starts to rise due to voice coil inductance.
How to design loudspeakers - video courses


What does this phase angle do in the real world? Well, it actually tells us how much heat the amplifier will dissipate in correlation to how much power it will deliver to a certain load (the speaker). The phase angle will vary from -90 degrees to +90 degrees, but in the real world it will have a narrower range : [-45 ; +45]. At 0 degrees the amplifier will deliver as much power as it dissipates as heat. In the worst case scenario, 45 degree angle, the amplifier will heat up 4 times as much as the power it delivers. So if the amplifier delivers 100 W of power to the speaker (at a 45 degree phase shift), it will heat up like it’s delivering 400 W.
Bass reflex impedance charts
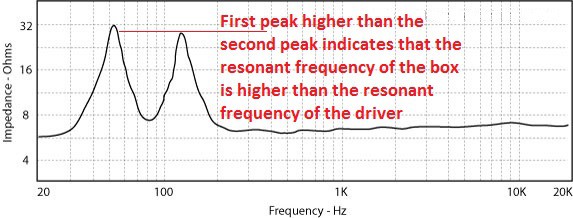
Unlike with free-air and sealed enclosure impedance charts, the bass reflex impedance graph will show 2 peaks . Here is an example :

The point between the peaks which has the lowest impedance, marks the resonant frequency of the box.
Depending on how the 2 peaks compare to each other, in terms of height, we can consider 3 particular cases :
- The two peaks match in height. This means that the resonant frequency of the driver in free air (fs) matches the resonant frequency of the box (fb).
- The first peak is higher than the second. This means that fb > fs.
- The second peak is higher than the first peak. This means that fb < fs.


Conclusion
Now that we got the speaker impedance curve explained, you can read in between the lines when you see one. Whether it’s the driver in free-air, acoustic suspension enclosure or bass reflex box, the impedance chart tells all kinds of useful information, if you know where to look for them.
References
- The Complete Guide to High-End Audio 5th Edition by Robert Harley (Acapella Publishing, 2015).
- Audio Engineering Explained by Douglas Self (Taylor & Francis, 2012).
- Image source : AI generated
Learn loudspeaker design from scratch

44 comments
Hi there,
what about the magnitude of the impedance peak?
when it’s a high or low peak what does it indicate?
many thanks
Simon
Let’s say you are looking at the impedance chart of a tweeter. If you see a very high and sharp peak (maybe 40-50 Ohms), it might suggest that the tweeter will “overreact” at that frequency. Let’s say that the resonant frequency is at 800 Hz and you cross it at 2000 Hz, it might ring at 800 Hz because of this peak. You have to cross it higher, use and notch filter to tame the peak, or increase the crossover slope, if you are confronting with this issue.
If the peak is low it just means that it’s a “crossover-friendly” driver.
Hi taking into consideration the 3 particular cases you mentionned, which one will give a more efficeint output as regards sound (bass) volume output, I ask this because I do not have equipment to measure sound level output and would like my bass driver monacor SPH255 to sound a little bit louder.
Thank u.
ALDo
Well, the impedance isn’t the indicator which you should look at. The volume of the box and the tuning frequency is what directly influences the output of your system (the impedance curve is just the result of that). A larger box will yield a higher output. For the same box volume, a higher tuning frequency will result in a higher output at higher frequencies, but compromise lower frequencies.
Hi Marius
I am getting completely different impedance measures for 2 identical enclosures Vb 45 Litres with identical vents of same diameter 86 mm and length 240mm. Tests have been done with the same driver monacor SPH255. HAve double checked and there is no air leakage.Software used is LIMP from Arta.
Box A has first peak higher than second peak. Fb frequency between the 2 peaks is 23Hz
Box B has opposite measure that is second peak much higher than first peak. Fb frequency between the 2 peaks is 28Hz.
I have to finalise the enclosures and this issue is getting me nuts.
Grateful to have any explanations.thank you.
ALDO
If the boxes are identical, then it means you have some air leakage. It’s difficult to check if you do have it. Common places for air leakage is the place where the port fits to the enclosure, and at the binding posts. My advice is to use silicone caulk to every joint of the enclosure, and put more effort around the port. That way you can be sure both of them are air tight. Wait one day for the silicone to completely cure and recheck your values.
You might want to use the same speaker for each enclosure when you are measuring. Although the resonant frequency of the box is independent of the driver you are using, the impedance chart will look slightly different if one driver is broken-in and the other is fresh out of the box.
Thank you for your advice about the use of silicone caulk. Will do and measure after cure.
Tks
Loudspeaker spec sheets base frequency response/sensitivity graphs on SPL for 1W @ 1m (sometimes specified as 2.83V @ 1m for speakers rated 8 ohms nomimal impedance).
Loudspeaker impedance (Z) varies with frequency. The spec sheet impedance graph for my 15″ shows Z ranges from 7 ohms min @ 150 Hz to 16 ohms @ 1500 Hz acoustic crossover to 70 ohms max @ 20 kHz resonance & also 70 ohms @ 35 kHz resonance.
Amp output power varies with loudspeaker impedance load. My amp manual shows rated power of 300W RMS @ 2 ohms, 200W RMS @ 4 ohms & 120W RMS @ 8 ohms, presumably implying as little as 14W @ 70 ohms.
Does the above indicate that the typical/small signal frequency response decibels of my amp+woofer is actually a roller coaster resembling the inverted loudspeaker impedance load curve with half the watts (3 dB less output) @ 16 ohm/1500 Hz and as little as 1/10th the watts (10 dB less output) at higher frequencies and at resonance (or the peaks adjacent to resonance subdued by bass reflex tuning) than at the few frequencies that it actually has an impedance of 8 ohms?
If so then aren’t loudspeaker spec sheet frequency response/sensitivity graphs unrepresentative of an actual system & only relevant for comparing lab test differences between loudspeakers where constant power or voltage is maintained at all frequencies that never occurs with a users amplifier?
Thanks in advance for your response.
Well, not really. In theory, the frequency response should maintain as you increase the output on your amplifier. So, at low to mid levels, the frequency response should keep its shape. As you start to push the speaker and/or the amplifier then the rules aren’t valid anymore, as you say. But still, if they are of good quality, they should maintain the frequency response. I’m working on a speaker right now and I just tested this. Measured the frequency response at a low level. Then, cranked the amp and lowered the level of the mic (so it doesn’t clip the mic) and measured again. The response is identical with a small deviation at the crossover point ( … interesting). Regarding the power vs impedance, things are not that straightforward. So for example, at resonance frequency, where the impedance spikes, it should receive the least amount of power. But since the speaker moves with the least amount of effort (at resonance), things balance out acoustically.
Thanks again for your reply. I agree that actual frequency response should maintain a relatively constant shape within the range of typical volume control settings until you approach the amp’s output limits, and that the 35 Hz resonance response is a unique combination of low power & high excursion. However I have the impression that the actual amp+woofer response is significantly different than the response shown on spec sheets for 1W @ 1m because of the effect of impedance on amp output for most volume control settings. In other words even though the 1W (2.83V) @1m spec sheet frequency response curve for an 8 ohm rated 15” shows 98 dB at both 150 Hz & 1500 Hz, since the impedance is actually 7 ohms @ 150 Hz & 16 ohms @ 1500 Hz won’t the response with an amp like mine be slightly > than 98 dB @ 150 (7 ohm impedance allows the amp to deliver 8/7 of a Watt at the same volume control setting that delivers 1W @ 8 ohms impedance) and only 95 dB @ 1500 Hz (16 ohms impedance cuts the amps output to ½ Watt at the same volume control setting that delivers 8/7 Watt @ 7 ohms & 1W @ 8 ohms). If so doesn’t that mean frequency response curve of my amp+loudspeaker increasingly diverges from the woofer’s spec sheet frequency response curve to increasingly lower dB as impedance increases to 70 ohms above (& up to 70 ohms below) 150 Hz with the exception of the unique response around the woofer’s 35 Hz resonance? Your test showed the frequency response maintained the identical shape at various volume & dB settings with an actual amp, but is the shape identical to the shape of the woofer’s 1W @ 1m spec sheet with no crossover involved to complicate the comparison, or do the two shapes look more like two different speakers due to the decline in amp output with the increase in impedance at higher & lower frequencies than at the frequencies around 150 Hz that are near the nominal rated impedance of most woofers?
John, I think you are confusing efficiency with frequency response. There is no difference between the amp in the lab and your amp (considering that both are working properly and don’t color the sound). They both get that roller coaster of different wattages at different frequencies, as you talk about. When you measure efficiency you use a test tone signal (usually 1 kHz), and see how many dBs it pulls out, at that one single frequency. The frequency response can be measured at all kinds of levels. So let’s say you got 95 dB at 1W/1m for that 1kHz test tone. Then, you take your frequency response curve, and match the 1 kHz point for 95 dB. Then, the rest of the frequencies fit in the right place. That is if you want a to know the frequency response at 1W/1m.
If you get a different response than the one quoted by the manufacturer there can be a lot of reasons : cheap speaker, variance on production batches, the speaker is not burned-in yet. And the most important, the frequency response measurement is made in a half space environment (infinite baffle). When you measure you speaker, you probably measure it in your enclosure (with a finite baffle). The shape of the edges, positioning of speaker also severely impact frequency response. So, it’s absolutely normal to get something else than the manufacturer spec sheet (especially in the mid frequencies where the baffle skews the frequency by quite some margin).
Thanks again for your reply. I hope the following makes what I am saying less confusing. I’m referring to frequency response across all usable frequencies, not average efficiency/sensitivity or response at a single reference frequency like 1 kHz. A woofer’s spec sheet frequency response curve is an accumulation of data points tested one frequency at a time, each with 1W @ 1m, which means the woofer’s input voltage (e.g. the lab amp’s volume control) is adjusted at each measured frequency data point in order to force the amp to deliver exactly 1W to the woofer at each frequency, thereby negating the effect of impedance variation. However in actual use if the amp’s volume control is set to deliver say 100W @ 8 ohms impedance then, without an equalizer, every frequency depends upon that volume control setting, which means that an 8 ohm impedance at 100 Hz allows the amp to deliver 100W to the woofer, but at 1500 Hz the actual impedance of 16 ohms cuts the amp’s power at 1500 Hz by about half (-3 dB) and cuts the power by 4-10 dB at many other frequencies where the actual impedance is higher than 16 ohms. Since amps in actual use producing the entire frequency range simultaneously don’t have a feedback system that automatically adjusts the output voltage for each frequency to force the same number of watts to be delivered at every frequency, the actual frequency response of an amp+woofer is different than the woofer’s 1W @1m spec sheet frequency response. An equalizer can correct the divergence, but since spec sheets to not show the effect of impedance on frequency response, there is no reference point for equalizer settings. Instead, loudspeaker spec sheets should show a frequency response curve reflecting the effect of that woofer’s impedance on a standardized amp. The standardized amp can periodically be updated with an update identifier to reflect the changing technology of amps and their response to loudspeaker impedance load. Is this correct & reasonable to you?
I understand what your are saying. I’m just telling you that you got it all wrong. The frequency response measurement is just a sweep with an amplifier no different that any other amplifier, with no additional fiddling to match 1W at every frequency. That would be time consuming and downright pointless, because the data would have no real world meaning.
Great, thanks, that’s what I was after. That means spec sheets are representative of actual use with the “1W @ 1m” footnote on frequency response curves apparently referring only to the nominal rated impedance, e.g. 8 ohms. If so then the footnote should say “1W @ 1m @ 8 ohm nominal impedance” to avoid misleading readers like myself that literally interpret the “1W @ 1m” footnote as a constant condition maintained throughout the frequency response curve, especially with spec sheets that also include an impedance curve that reader’s might therefore use to adjust the frequency response curve unnecessarily with basic physics equations.
Hi Marius, apart from your earlier explanation taking as example of a tweeter which will overreactand will be ringing at a certain frequency, could you please explain why some drivers that I have been measuring have a high impedande peak at fs and some a very low fs, is it due to the motor’s force and is it related to efficiency? How will it affect the sound?
Well, a high impedance peak would suggest a high electrical damping. So the speaker is hold in place (damping) by its suspension (mechanical damping) and by it’s electrical damping (back-emf generated by the coil). If the suspension is loose, then it should compensate with a higher electrical damping (higher Qes number), and a larger impedance spike. A high Qes number would suggest a speaker which is more suitable for sealed enclosures.
Why does the impedance peak at the system resonance become attenuated (less of a spike) when some resistive pressure release (tending toward aperiodicity) is allowed in a sealed box system?
So I’m currently building 4 subwoofers that are currently DVC 4 Ohms and my amp is made to run at one Ohm. The lowest I can reduce my 4 subs into the amp is 2 ohms without going under. So my question is this. What do I need to adjust on the voice coil windings to make my speakers dual 2 ohm voice coils????
You are joking, right? You want to unwind the speaker coils just to get the amp to play at a lower load?
From normal Sp ytem measurement the IMP flot between 2 to 40 ohm and electrical phase between -45 degree to + 45 degree , How does will effect the sound ?
Dose this +/_ phase degree will change original signal from AMP to SP polarity and amplitude ?
Thanks
How to check the fs and fb for dual subwoofer using the impedance curve ?
Fs is the resonant frequency in free air. So basically you can measure the impedance of each driver separately and you can check the resonant frequency of each one. The peak in impedance will correspond with the resonant frequency of the driver.
Fb is the resonant frequency of a bass reflex box. Regardless of how many speakers it has, you simply measure the impedance of the box (so you measure the 2 drivers at the same time, because they are wired together either in series or in parallel). The Fb will be at the dip (minimum impedance point) between the 2 peaks on the impedance chart.
What does multiple peaks in the impedance curve of horn loaded ported subwoofer indicate ?
Probably some resonances induces by the horn at those particular frequencies.
Thank you for the write-up!
Just wondering if there are ranges for the spike where it becomes a real problem, because when I try crossovers in Xsim, sometimes the components would exacerbate the spike (especially problematic for woofers), and I’m worried if it becomes a fire/electrical hazard at some point, either for the speakers, crossover components, or the amplifier.
Impedance spikes are actually good for an amplifier, as high impedance will make an amp run cool. Dips are the ones you should look after. If the impedance gets too low, the amp will heat up and probably shut off as it triggers its overheating protection.
Thanks, did not think of it that way. Are there any other reasons where we should keep resistance within a certain region?
Not really. High, sharp, impedance peaks might suggest a large resonance at the frequency. Speaker might ring at that frequency. Sometimes this happens to tweeters.
Hi Marius
Is there a rule or a preferred tunning of the box? Fs>Fb, Fs<Fb, or Fb=Fs?
It depends. Fb lower then Fs, you basically extend the frequency response of the driver, but the box is bigger. Or Fs
hi nariamus , is there any book or video tutorial for tunning subwoofer fox especially for such bass reflex ? how to tune in the best position , the right tune of Fi, Fb ,Fh?
if i have Fs at 30 hz 80 degree and going to insert to subwoofer bass reflex box, it should be Fb increase 1 step up to be minimum 40 HZ? and which phase shift degree the best ideal for subwoofer works range if we look it by the side of phase shift data sir..
best regards
In the real world we don’t really concern ourselves with phase shift when it comes to box design. This article is just some technical mumbo-jumbo to explain the in depth details of the impedance curve. In the end, you only care about how the frequency response looks like. If you want to learn how to design speaker boxes I have multiple courses for that. You can check them out here : https://audiojudgement.com/courses.html
Hi Marius,
Sorry if the next question is stupid but I want to understand.
Some texts say that the first peak in a vented box corresponds to the port resonant frequency, and others say that the port resonant frequency is between both peaks an is equal to the resonance frequency of the box. 1) Who is correct?
2) If the port resonance frequency were different from the box assembly resonant frequency, why is the length of the port calculated based on the resonant frequency of the box?
1) I don’t know who says that. Maybe you are confusing with a sealed box where there is only one peak and that coincides with the resonant frequency of the box.
2) Port tuning, box resonant frequency are just some loose terms that mean the same thing. When you say port or box, you are referring to the whole system.
Port length is calculated based on which frequency you want to achieve, the volume of air inside the box and the diameter of the port.
For instance here: http://archimago.blogspot.com/2019/08/measurements-speaker-impedance-part-2.html they are describing three different resonance frequencies (…”Fl (port resonance frequency) and Fh (woofer resonance), with the nadir of the valley between these peaks, corresponding with 0° electrical phase Fb, also known as the ‘box resonance frequency’ “).
So, I am a bit confused with those different resonant frequencies.
Thanks for answering. I am a huge fan of your work. Greetings from Colombia
Thank you for the helpful article. I am testing a pa system for damaged/ worn drivers, and I have a question. How might these readings be affected when a speaker is damaged?
Besides the normal shape of the impedance curve, you will probably see additional little spikes in the impedance curve.
Hi!! Thank for the nice explanation. Still too technical for me… there has been a great debate last years regarding impedance curves in reactive load boxes for guitar amps. Some of them incorporate the impedance curve of a well known speaker with its right resonant peak while others have a more generic impedance curve with no particular resonant peak, but being posible to adjust that by software later… is there any chance that an amplifier can be damaged because of this?
Thanks!
if the impedance dips too low, and if the amplifier doesn’t have overheating protection, it will fry itself.
Marius thank you. You have helped me more times than you know with sharing your knowledge like this. With stating your free air phase/freq curves and based on graph results we can have phase shifts anywhere from -90 – 90 degrees. With 0 being fundamentally resonance and a balance of the mechanical electrical system there. You stated the output power device/source would basically be at balance there which makes sense. So that when increasing phase of the current/voltage variation the output source has to work harder because the current is lagging behind the voltage in the circuit. You explained briefly what that result would look like in real world with 45 degrees phase and extra heat on the amplifier. Can you share what it means to achieve negative phase and how to affects output power source? Also how does amplifier dampening aid in efficiency of a mechanical/electrical transducer, likewise how does a electrical mechanical transducer aid in dampening with its own dampening electrically and mechanically for and against the output power source? Thank you sir!
Will a single driver speaker have a uniform impedance curve or will it still be frequency dependent?
Yes, conventional drivers have frequency dependent resistance, regardless if it’s only one or multiple drivers wired together. Some niche drivers, indeed have fixed impedance like AMT Tweeters.
“At 0 degrees the amplifier will deliver as much power as it dissipates as heat.”
Are you sure?
If I assume 8 watts into an 8 ohm speaker that’s showing zero phase shift, I will have one amp of current.
And if the amp has an internal impedance of 8 ohms, then it will be dissipating 8 watts.
This is the classic DC condition for Maximum Power Transfer, and gives an efficiency of 50 %.
But any solid-state amplifier will have an output impedance that is *much* lower, typically unde one ohm.
Now, for the same 8 watts in the speaker, we still need the same one amp, but the power loss in the amplifier’s source will be (for an internal impedance of 0.5 ohms) just 0.5 x 1 = 0.5 watts.
This is much less than your “amplifier’s loss=speaker power” description above.
I expect that *any* practical system will see the amplifier with an output impedance that is *much less* than the speaker (load) impedance, and therefore, than any practical system’ internal power dissipation will be little affected by phase angle variation with frequency.
I didn’t read your description of another problem, though.
If the speaker’s phase is frequency-dependent, then *surely* this would affect sond staging in a stereo setup, where some instruments would “wander about” as the notes they play go up and down their playing range.
Your thoughts?
Ian Batty, M.Ed.
Thank you for your explanation.
I have a question.
In the case of an impedance chart in a bass reflex speaker, There are 3 examples, Fb=Fs, Fb>Fs, Fb<Fs.
I'm wondering about correlation between low frequency and impedance amplitudes of Fb and Fs.