
Group delay explanation and measurement
What is group delay?
Let’s try to give a beginner friendly group delay explanation. First of all, you will find the term group delay in all kinds of areas which involves electronics. We will focus strictly on the audio segment. An audio system is made by various electrical components. As a result, when the audio signal leaves the source, it passes through amplifiers, wires, crossovers, speaker drivers etc. This will introduce a certain delay from the moment the signal exits the source and the moment it reaches our ears or a measurement microphone.
This time difference between input and output is actually a time delay. It is, however, considered to be group delay, only if the delay is constant, as a result of linear change in phase throughout the frequency bandwidth. Another group delay explanation is that it’s the delay which happens to the envelope of the signal.
The math
I know you are not excited about math formulas, but we have to start somewhere. Stick with me, it will get better. Here is how you calculate group delay :

Group delay is the negative of the derivative of the phase curve with respect to radian frequency. So in loose terms, it’s in direct correlation to phase at different frequencies. Group delay (GD) is measured in milliseconds (ms).
- Phase is measured in radians.
- Radian frequency is measured in radians / second.
- As a result, GD has units of time (seconds, most likely, milliseconds).
In other words, GD is a measure of how fast the acoustic phase changes at different frequencies. It tells how well time relationships between a small group of frequencies are preserved in a narrow frequency region, around the point in frequency where the group delay is evaluated.
Group delay measurement
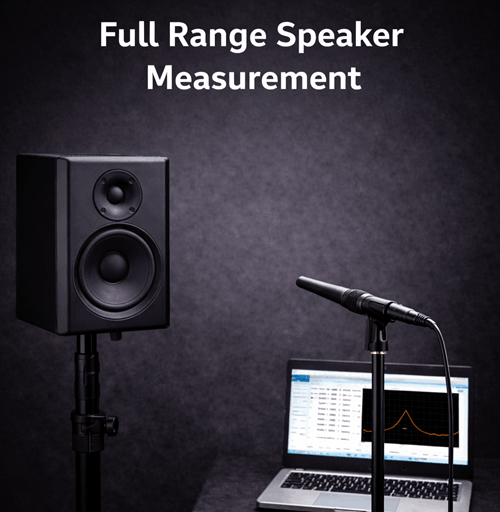
Measuring group delay is simple enough, if you have done frequency response measurements. Basically, from the impulse response you can extract the frequency response, the phase and the group delay. In conclusion, grab your measuring microphone (Amazon affiliate paid link) and fire up ARTA. This is what we will use for the purpose of this measurement.
How to design loudspeakers - video courses


Just like a normal frequency response measurement, take an impulse response. If you don’t know what I’m talking about, make sure you check out this article. And we are going to use the exact same measurement of the M-Audio BX5 from that article to extract the group delay. For now, let’s make a far field measurement and set a gate window according to our room size (for the anechoic response). Then, click the frequency response button, like you would normally do :

As you can see, there is a little button at the bottom, called GD. I’m sure you are smart enough to realize it stands for group delay. Go ahead and click it :
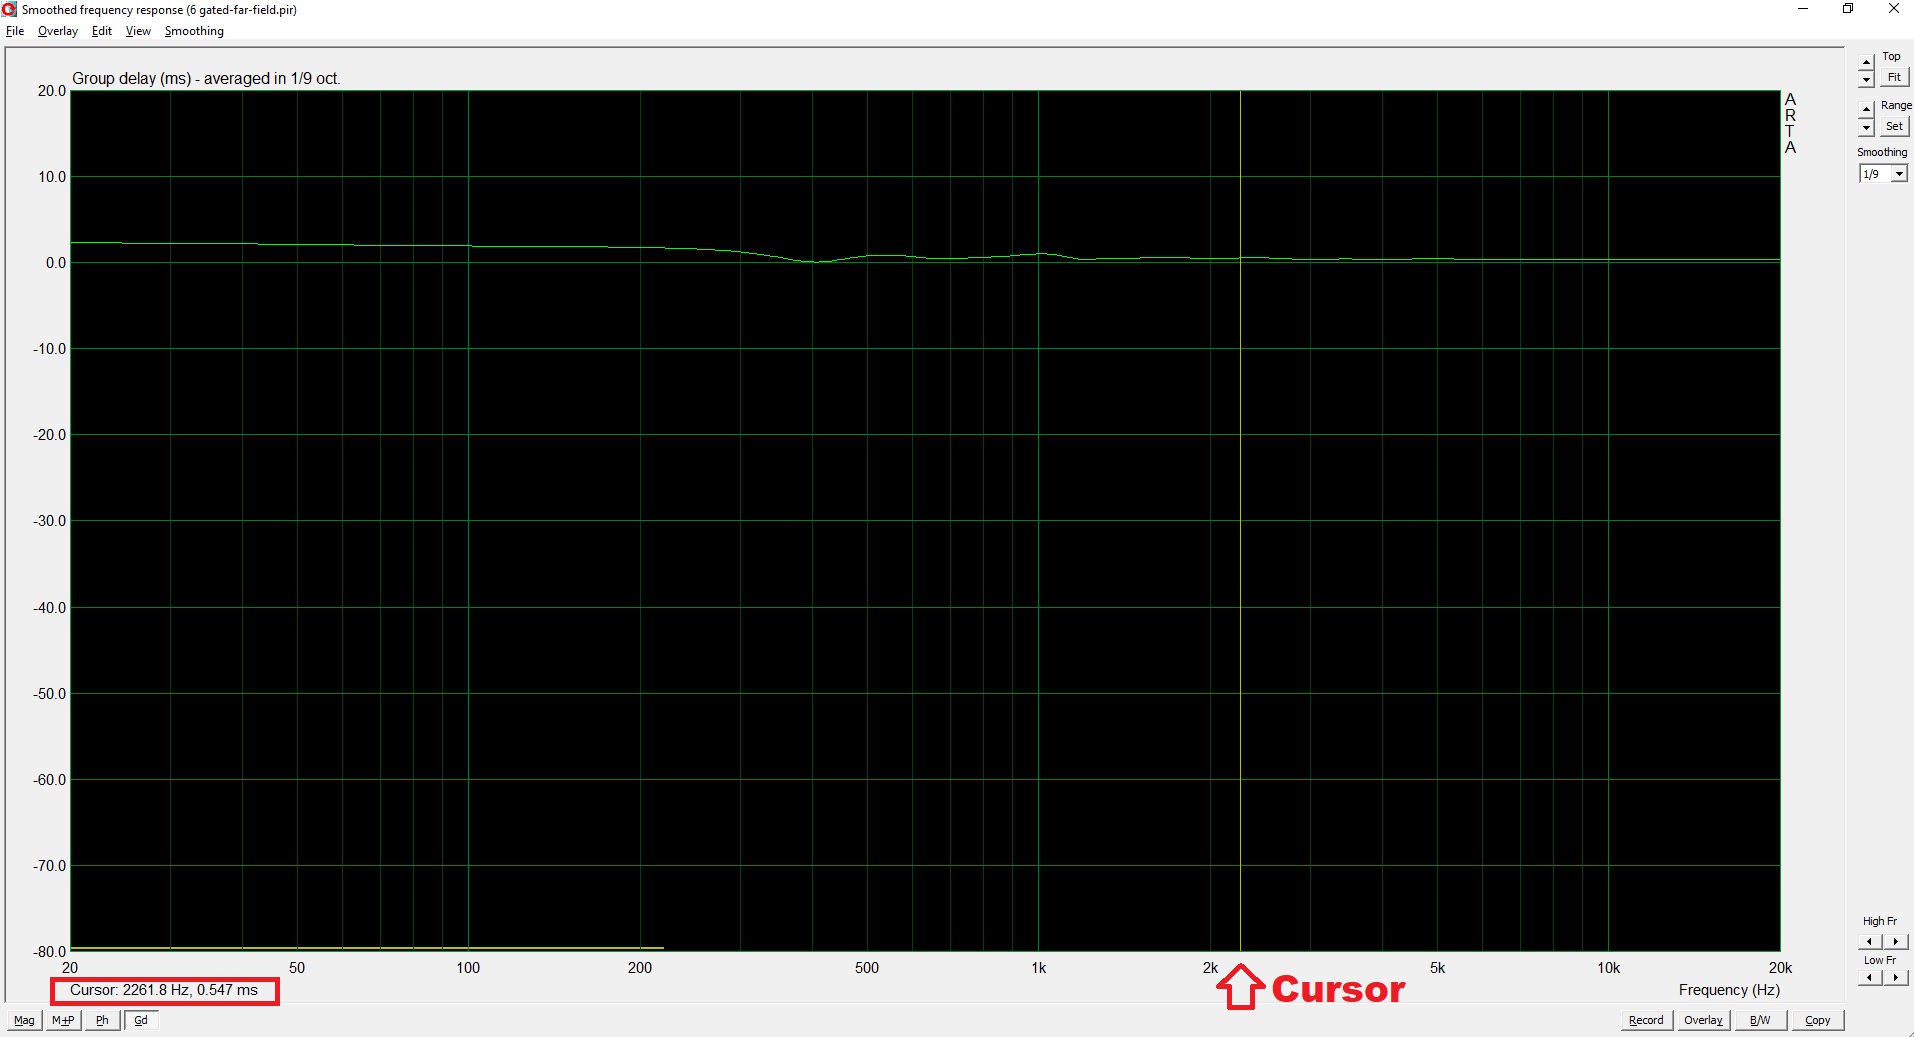
Slide around the cursor to see the exact value of the group delay at different frequency ratings. If we take a quick look, GD is under 1 ms and most of the time under 0.5 ms, which is awesome. To get the group delay information for the lower frequencies, we need to make a nearfield measurement. Here is how the chart looks like :
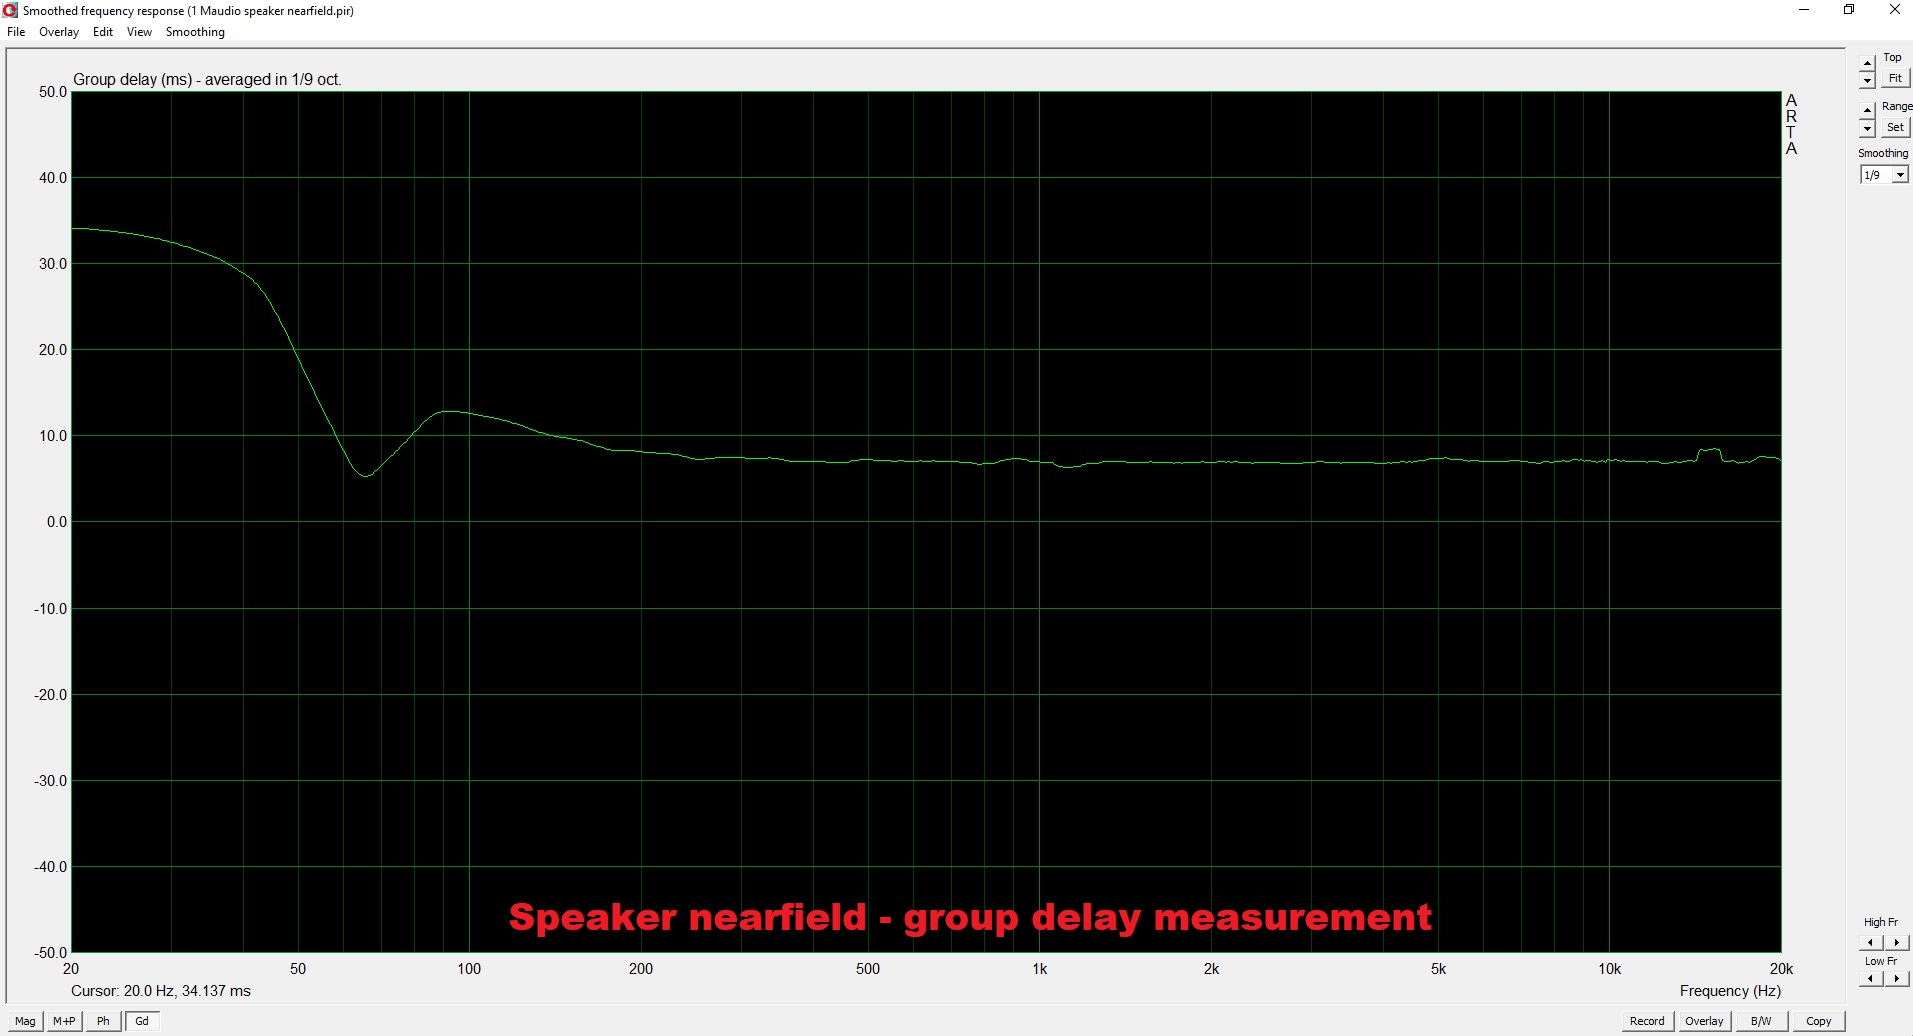
As you can see, for the lower frequencies the group delay is much higher. Continuously rising as frequency decreases starting with 150 Hz. There is a dip in GD at around 64 Hz. That point marks the resonant frequency of the box. At this point the speaker barely moves. Group delay resumes its rising trend as the frequencies get lower and lower. This is to be expected. Let’s take a look at port GD :

Above, we have a nearfield measurement of the port. As expected, the group delay is rising as frequency decreases. It is normal to have values above 10 ms for the lower octaves.
Group delay explanation and interpretation
What to look for when judging group delay numbers. Well, the smaller GD number, the better. However, there are are certain guidelines, with respect to frequency, when it comes to group delay values. You can expect to have low GD for the higher frequencies, and unavoidably, higher values for the lower octaves. In conclusion, here are some numbers as reference :
- 1 kHz and above – anything less than 2 ms is good.
- 200 Hz – 1000 Hz – less than 4 ms.
- Under 200 Hz – Expect higher numbers. Even 30-40 ms for the very low frequencies.
The enclosure type is one of the major factors that determine how good the low frequency group delay is. Simpler designs will have a better GD. As a result, a sealed enclosure will be better than a bass reflex, which in turn, will be better than a 4th order bandpass, 6th order bandpass etc. These are some real life guidelines, where the lower frequencies tend to have higher delay. However, in a linear phase system, if you have a very high delay, but it’s the same at all frequencies, you’re good.
What about negative group delay? Sometimes, when you will do a group delay measurement, you will encounter a negative value. Does that mean that the signal reaches the microphone/listener before it has left the source? We know that is not physically possible. However, in some intances, if the signal is predictable from past values, group delay is negative, as the filter tries to predict the input. This is some confusing stuff, so don’t bang your head too much on this, as I tend to do the same.
Conclusion
Group delay is something people overlook, but can hold useful information. While it isn’t something straightforward and easy to comprehend, with experience you will understand its significance. Since taking an impulse response is not a difficult thing, a group delay measurement is just a click away. On your future projects, keep an eye on it and observe how it changes on different setups.
References
- Testing Loudspeakers by Joseph D’Appolito (Audio Amateur Pubns,1998)
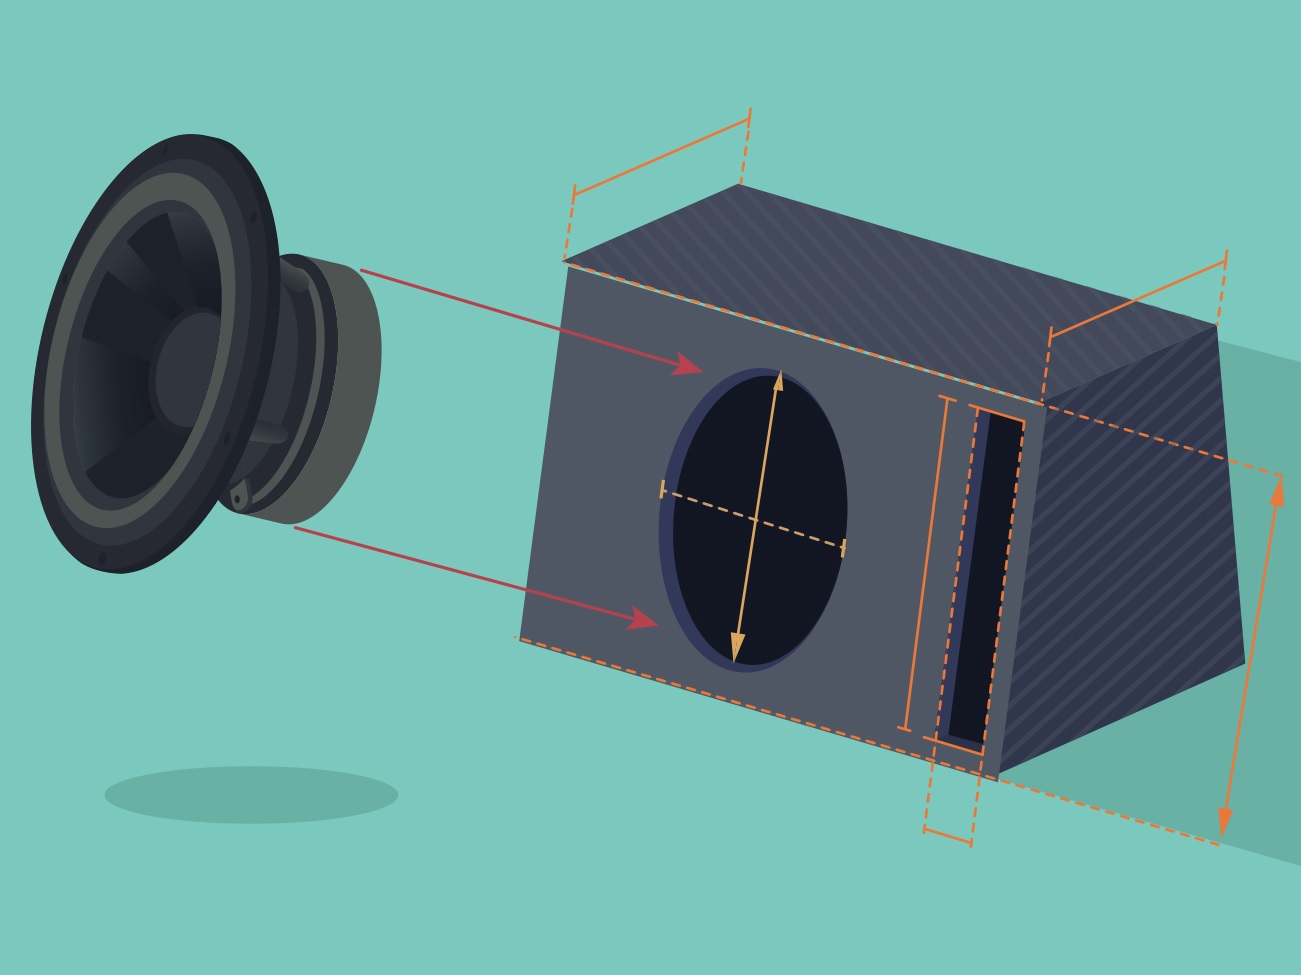
- Image source : Ai generated
You May also Like


Learn loudspeaker design from scratch

2 comments
what is the difference between ARTA and REW
Haven’t used ARTA in a long time. It’s not as straightforward as REW and is also not free. So, it’s difficult to not use REW over ARTA. ARTA does have some functions that REW doesn’t, but I haven’t use it in such a long time that I couldn’t tell you exactly which of those are (only LF box diffraction comes to mind).